Chapters
- Synopsis
- Relevance of the Map to Creation Science
- Introduction
- Resources
- How this project came together
- Background on Johannes Vingboons and His map
- Using Jupiter's Moons As A Clock
- The Lake and the Rio Del Norte
- The Mouth of the Rio del Norte
- The Wasatch Mountains
- The Rocky Mountains
- The Gulf of California Eastern Shore
- Into the Channel: Connecting The Channel To The Gulf
- Into the Channel: The Four Islands
- Into the Channel: East Coast at the North End
- The Island Coastline - Northern Portion
- The Island Coastline - Eastern side of Passage
- The Island Coastline - Lower Baja Coast
- Maps With California Attached
- Maps of the Mississippi Before the Uplift
- Conclusion
- Post Script - Another Island Deemed to be Mythological
- About
Synopsis
The California as an island map gives us a snapshot of the Western United States and Mexico toward the beginning of the ice age. The Grand Canyon has not yet formed, and the uplift of the Western states has not begun. Only two major western mountain ranges have formed: The Rockies and the Wasatch range. The Sierra Nevada range and the coastal range do not appear on the map, and in light of the accuracy of the map in general, we can be fairly confident that this is because they were not yet there. Why is this important to young earth creationist? This is the smoking gun that shows that the Atlantic Rift, the Sierra Nevadas and Coastal Range, the Western States uplift, and the Grand Canyon, were formed, not millions of years ago, but in historical times. Most important is that the map stands on its own. Creationists cannot be accused of manufacturing it because it has been around for over four hundred years and is based on sources obviously thousands of years old. Evolutionists have no way to respond to this except to ignore it or call it a myth. But the accuracy of the map and the details it reveals testify to its validity.
Relevance of the Map to Creation Science
The first question I am always asked is "What does California being an island have to do with Creation Science?" So let's answer this first.
In his article Recent Rapid Uplift of Today's Mountains Dr. John Baumgardner has outlined the series of events that occured during and after the flood, leading to the location of the earth's continents, mountain ranges, and uplifted elevations.
His sequence is:
Upwelling of hot molted magma from the core of the earth, rising up against the underside of the original single continent, Pangea.
Pangea splitting with North and South America heading west, and the Pacific Plate subducting under these continents.
Scouring flat of the surface of the land by great tidal waves washing over the earth twice daily and depositing the flat geological layers.
A series of buckling events, where mountains were pushed up, exposing and tilting the flat geological layers.
An uplift of the area over the subducted Pacific ocean floor material, now under the western United States. The uplift took centuries to happen.
So what does the California As An Island map show?
The Appalachians are not shown on the map but we know from other ICR studies that these were pushed up during the flood.
The Rockies and the Wasatch mountain ranges are shown, so mountain building has progressed this far.
The Sierra Nevadas and Coastal range are not yet pushed up, although, as we discuss later, the Panamints may have been. This indicates the map was made in the centuries after the flood, but in the middle of the mountain building process. The coast of northern California extends well out into the Pacific, as it had not yet been pushed in to form the Sierra Nevadas and Coastal Range.
The western edge of Nevada is still at sea level, indicating that the uplift process, which took centuries, had not yet begun.
The Grand Canyon has not yet formed, indicating the map was made before the end of the ice age. The lake at the north end of the major river on the map, the Rio Del Norte, is relatively small, indicating the glaciers of the ice age had not begun to melt.
Taking all this together, the map was made in the first centuries after the flood. The mountain building process was underway but not finished. The uplift had not begun, and the ice age was far from over. And most importantly, we have a snapshot of the earth that verifies the sequence of events of the young earth creationist view.
I knew none of this when I started looking at the map. The first thing I wanted to know was whether the map was real. And so let's answer that question. But first some background on the map.
Introduction
Some time in the past, before the ice age, most of western North America (and probably the whole world) was accurately mapped by a technologically advanced people. Who these people were and what technology they used is lost to us, but their maps remain as evidence that they did indeed accomplish the task. These ancient source maps were used by mapmakers in the 1600 to 1700s to fill in the vast unknown areas on the western side of North America. The recent mapmakers had no idea what was there, nor did anyone else, but they had source maps that showed the area as an island and they used them to fill in the gaps.
When were these source map made? They had to be made before the end of the ice age, because at the end of the ice age, the great ice dam holding back water in a huge lake finally gave way and the Grand Canyon was carved in just a few weeks. The Grand Canyon does not appear on any maps of California as an island that I have found, and is certainly not on the map used for this study, the Vingboons map of 1651. In fact, on the Vingboons map, two rivers cross the location of the Grand Canyon. This creates a problem, because the ice age supposedly reached a maximum 18,000 years ago (see Wikipedia article ), putting the date for modern man well before that. This pushes the date back into the realm of the Neanderthals, or even into the Paleolithic period, when we were supposed to be only capable of using stone tools.
An even greater problem is that the map also had to predate the uplift of the Nevada-Utah-Wyoming-Colorado area that followed the end of the latest continental drift event in North America. (see Wikipedia, Farallon plate) According to continental drift theory, when the continents were spread apart, the North America continental plate was pushed over the Pacific oceanic plate, which was forced down into the mantle of the earth. The lighter minerals floated up against the bottom of North America, under the Nevada-Utah-Wyoming-Colorado area. This area was lifted up from sea level (at least in Nevada, where the map shows where the sea encroached) to over 7,000 feet elevation in central Nevada, and similarly across all these states. The routes of rivers changed. The Rio Grande, shown on the Vingboons map as the Rio de Norte, which used to flow into the Gulf of California, was forced to flow to the Gulf of Mexico. The map places a geologically recent date on continental uplift, the uplift having happened after the map was made, putting it within the historical presence of humans on earth. Geologists date the North American continental drift event to the Jurassic period, 200,000,000 to 150,000,000 years ago. How will Science deal with the loss of 150,000,000 years? Since it requires abandoning a well entrenched worldview, it is most likely that the vast majority of academia will simply ignore this study and its implications.
In the following series of articles, I analyze the Johannes Vingboons "California as an Island" map area by area. I show that the makers of the original map possessed a detailed knowledge of the geography of western North America. Correlation of features on the map to actual locations demonstrates that the map is very accurate. After the analysis of the map I have included some information on the historical mapmaking and exploration of this area by the Spanish after the arrival of Columbus. The Spanish were extremely slow to explore this area, and the information they had was not allowed to be made public because they needed to protect information on their trade routes from their competitors. Vingboons could not have been using Spanish information to present California as an island.
Resources
Glen McLaughlin: The Mapping of California, An Illustrated Checklist
Stanford Library, Glen McLaughlin Map Collection: California as an Island
I owe special gratitude to Glen McLaughlin, list above, who purchased over 800 maps of California as an Island to form a personal collection. He published an index of his collection (the Illustrated Checklist) with over 250 entries. I had contacted him with my work on his maps and my web page. He replied that he liked my work but it would not be received by academia. He was correct. We all owe a special gratitude to Glen McLaughlin because he decided to donate his extensive collection to a university that would scan his maps and make them available to the public. Stanford agreed to this and has made high quality scans of all the maps available at the link above.
Gregory C. McIntosh: The Piri Reis Map of 1513
McIntosh identifies the rectangular island off North Carolina as the Caribbean island of Hispaniola, which I completely disagree with. More on that in the extra material at the end of the web page. McIntosh includes an excellent bibliography for further study.
Charles Hapgood, Maps of the Ancient Sea Kings: Evidence of Advanced Civilization in the Ice Age
This is the book that got the ball rolling. Hapgood managed, as far as I know, to keep his job in academia, something that would not happen today, as Ben Stein documents in "Expelled", something people I know personally have experienced. Hapgood also did excellent work documenting the dinosaur figurines at Acambaro, Mexico.
Robert Temple, The Crystal Sun
Robert Temple was also willing to go outside accepted acedemic thought and propose that the ancient had the ability to grind optical quality lenses for use in glasses and telescopes. This becomes important to the question of how did the ancients achieve such accuracy in longitude.
Dora Beal Polk, The Island of California: A History of the Myth
Polk chronicles the extremely slow progress of exploration along the California coast for the next two centuries and the political pressure to find that California was an island.
Michael Layland, The Land of Heart's Delight
Charlotte Harris Rees, Secret Maps of the Ancient World
JOHN BAUMGARDNER, PH.D., Recent Rapid Uplift of Today's Mountains
JOHN BAUMGARDNER, PH.D., Runaway Subduction as the Driving Mechanism for the Genesis Flood
How this project came together
What started out as a short investigation into whether one could identify the locations of four islands became an ongoing project comparing the map with the geography of the entire western U.S. Books and articles have helped, but most important was the many hours spent comparing the map with satellite views now easily accessible on Google Earth, Gradually, a confusing array of bits and pieces began to come together into something that made remarkable sense, and opened the door to there existing a map of a world long gone, and very different from what we see today.
All of this would never have happened if I had not come across a copy of "Maps of the Ancient Sea Kings", by Charles Hapgood. Hapgood demonstrated that the Peri Re'is map is an extremely accurate map of the eastern coast of North and South America. The problem with this is that the Peri Re'is map was published in 1516, only a few years after Columbus' first voyage. Hapgood showed that the Peri Re'is map was a compilation of at least four source maps, fit together into a mosaic, with errors in orientation that reveal which area of the map belonged to which source map. Where the original source maps came from is not known, but they were made by a people capable of measuring longitude with an accuracy far better than the Greeks, an accuracy not possible until the 1800s. Hapgood writes:
"We found... that one of the leading scholars in the field did not believe that the charts originated in the middle ages. A. E. Nordenskiold... pointed out that the Dolcert Portolano and all the others like it were a great deal too accurate to have been drawn by medieval sailors." (Hapgood p.9)
"Nordenskiold... was quite familiar with the maps of Claudius Ptolemy which had survived from antiquity and had been reintroduced in Europe in the 15th century. After comparing the two he found that the portolanos were much better than Ptolemy maps. He compared Ptolemy maps of the Mediterranean and the Black Sea with the Dulcert Portolano and found that the superiority of the portolano was evident."
Let us stop to consider for a moment what this means. Ptolemy is the most famous geographer of the ancient world. He worked in Alexandria in the 2nd century A.D., in the greatest library of the ancient world. He had at his command all the accumulated geographical information of that world. He was acquainted with mathematics. He shows in his greatest work, the Geographia, that he had a modern scientific mentality. Can we lightly assume that medieval sailors of the sixteenth century, without any of this knowledge, and without modern instruments except a rudimentary compass -and without mathematics- could produce a more scientific product?" (Hapgood p. 10-11)
Most importantly, Hapgood's research showed that old maps contain geographical features that should not have been known to mankind. The Oronteus Finaeus map of Antarctica, which dates to this same time period (1532) shows mountain ranges that have supposedly been covered by glaciers for a hundred thousand years, and have only recently been discovered under the ice by modern scientific techniques. How were these mapmakers able to map these mountains?
Over 250 maps from the 17th and 18th centuries show California as an island. The definitive catalog of "California as an Island" maps is "The Mapping of California as an Island" by McLaughlin. The first map in McLaughlin's catalog dates to 1621. Island maps continued into the 1800s, in spite of Spanish explorer Father Kino demonstrating California's connectedness in 1705 by walking there from New Mexico. But since there were no accurate maps of the New World, map makers continued to supply the market using ancient sources.
Hapgood attributes the ancient sources to maps preserved in Constantinople and later distributed by Turks. (p.9) That there were only a limited number of original sources is shown by their all falling into categories according to the features on the map. For example some show the California island with a flat top, others showing it with a "W" top. McLaughlin assigns maps to groups throughout his catalog according to features such as the shape of the top of the island. Since no explorers had mapped the California coast at that point, there was no way for map makers to know which source was right. As it turns out, both sources are right, they were just mapped at different times and different ocean levels.
Polk chronicles the extremely slow progress of exploration along the California coast for the next two centuries ("The Island Of California, A History of the Myth", Dora Beale Polk). She relates how Cortez mapped only the lower portion of the Gulf of California. Alarcon sailed up the Gulf to the Colorado River in 1540 and rowed up the river a long ways, but left no map. The explorer Onate reached the mouth of the Colorado at the head of the Gulf in 1604, over a century after Columbus' voyage. (Polk p. 261) In the late 1500s, Spanish trade ships followed ocean currents from the far east to the area of Mendocino, where they turned south to Baja. But they would not venture near the coast and so provided only limited information on California geography. (Polk, p. 244) In 1603, on a voyage cloaked in secrecy and plagued with misfortune, Vizcaino explored the Pacific coast of California up to Cape Blanco, Oregon, where they presumed a large river was the sought after passage to the Atlantic. (Polk, p.257). In all these explorations, Polk emphasizes the political pressure on explorers and map makers to find that California was an island. It was in the best interest of people like Cortez that California be an island, because Cortez was promised governorship of the island.
For the first three hundred years of western colonial rule, the southwest was still under the colonial rule of Spain, who closely guarded all information provided by its explorers:
"...the Spanish explorers did their best to collect geographic information via fragmentary field maps that found their way back to Spain, where they were in turn added to a master map that was guarded with utmost secrecy by the Casa de Contratacion in Seville." (Mapping and Imagination In The Great Basin, Richard V. Francaviglia, p. 23)
In light of this, it is not surprising that it took so long for mapmakers in the rest of Europe to produce an up to date map of the western U.S., and to discontinue the use of sources showing California as an island. As information from explorers gradually became available to mapmakers, the mapmakers integrated this new information into their ancient sources in the form of names and locations of rivers, bays, and points named by the explorers. Unfortunately the information provided by the explorers was more accurate in latitude than longitude, so mapmakers were at liberty to apply explorer's descriptions of the California coast to maps from ancient sources with no way to verify that it in any way corresponded to reality. (Polk p. 283). So, names of rivers in the interior were applied to the coastline of the inland waterway. Names of places on the Pacific Coast were applied faithfully to the western shore of the island, in spite of problems with longitude and the map coastline not looking like what the explorers described.
As evidence that the Spaniards had more accurate information, there are a number of maps in the McLaughlin collection that were published, starting in 1548, undoubtably to a limited audience, showing the true route of the Colorado into the Gulf of California and the lack of an inland passage. Here are links to several of them by year of issue: 1548 1553 1597 1599 1606 1752 1757 1720 1765
The origin of the original sources used by Vingboons and all the mapmakers in this era is unknown, but a writer in 1622 notes:
"...California, which is now found to be an Iland, stretching it selfe from 22 degrees to 42. and lying almost directly North and South, as may appeare in a map of that Iland which I have seen here in LONDON, brought out of HOLLAND;..."
Indeed, many of the maps produced over the next century came out of Holland, including the one to which we will pay special attention, the Vingboons map. How the sources got to Holland would probably be an interesting story. Many people claim that the ancient libraries in cities like Alexandria and Carthage were destroyed by the advancing armies of Islam. However, I have recently found a source that claims, more logically, that these libraries, being valuable collections, were confiscated by the generals of the Islamic armies as spoils of war. They were then sold off piecemeal to fund the coffers of the generals and to advance the war effort. The result would have been to disperse these collections and make them mostly inaccessable. A few books and maps apparently made their way into Europe and were used by the mapmakers. (Defending Islam Invaders)
Background on Johannes Vingboons and His map
Johannes Vingboons was a water colorist and artist for a cartography shop in Amsterdam. (Wikipedia biography) He had access to what information from the explorers of the day was publicly available, such as place names, and included this information in his maps. Obviously he had access to some other source that showed California as an island, but we don't know what that source is. However, we see the same flat shape of the north end of the island in many other maps of the time. This leads us to believe that all maps of this style had a common source, and all maps showing the "W" style north end of the island would have had a different source. It is interesting that while in some areas, such as the continental side of the Gulf of California, accurate information was known at the time from Spanish explorers regarding the coastline of the Gulf of California, Vingboons is faithful to his ancient source.
Vingboons includes place names from Spanish explorers that are fitted to features at about the right latitude on his source maps. Features that are still here today can be identified from his place names, such as Point Conception on the Pacific coast above Santa Barbara. Features on the map that no longer exist, such as rivers in the ocean passageway through Nevada, may carry the name given by an explorer to something that appears today at that latitude, but the map may bear little resemblance to today's geography and what the explorer saw. The coast of Mexico south of Hermosillo is portrayed close to how it looks today, but with some significant changes due to either an increasing land elevation or a decreasing ocean level (or both) of as much as a few hundred feet. A couple of major errors in the source map turned up: the mountain range on the west side of the Rio del Norte turns out to very accurately map the Wasatch mountains, after one shifts them north three degrees to the correct latitude. The lower half of the mountains on the east side of the river turn out to be on the wrong side of the river, and the upper half of this range is rotated about 45 degrees clockwise to where it should be. About three degrees of coastline is missing just above the entrance of the Rio del Norte into the Gulf. The rest of the map, which is all coastlines, inlets, and a river, becomes a detective novel to find how the ancient coastline matches what we see today.

Vingboons produced beautiful watercolor works of which this is a good example. The grid on the map is a portolan projection which according to Hapgood is an aid to the mapmaker in drawing the map, not a navigational aid. On the sides of the map are latitude marks in degrees. We will find that Vingboons' latitude scale must be shifted in varying amounts because his source maps were in sections pieced together and some sections were not properly placed. But within each area the map is exceptionally accurate, far more accurate than a Spanish explorer in the 1500s could produce, as was mentioned in the introduction. All these topics will be discussed in more detail as we go along.
Besides the obvious fact that California is separated from the mainland, there are a number of other things to note: the Rio Del Norte running prominently south from the lake in Wyoming empties well south of where the Colorado River meets the gulf today, and so is not the Colorado. As we shall see, the path of the central part of the Rio Del Norte matches exactly to the path of the northern part of the Rio Grande, which is also called Rio Del Norte, oddly enough. Also note there is no Grand Canyon or Sierra Nevada range. In fact there are two rivers running through where the Grand Canyon is located. The lack of the Grand Canyon indicates this map was made before the end of the ice age, before the Great Basin area (Utah and Nevada) glaciers broke through their ice dam and carved the canyon in a very short time. See Answers In Genesis article . This article proposes a sequence of events for the formation of the Grand Canyon: original plateau with rivers on it, canyon carved by ice dam breaking, uplifted plateau. This sequence is verified by the California as an Island map. The confirming evidence in this article would benefit Answers in Genesis. Perhaps some reader can point this out to them.
One other book that sheds some light on both the source of Vingboons' map and the problems we will find with errors in latitude and longitude is "Secret Maps of the Ancient World" by Charlotte Harris Rees. Rees documents the history of a Chinese map in the round style that was collected by her father. Her father discovered that it maps North and South America as well as the whole world. Of particular interest to us is the following information Rees quotes from "The History of Cartography" regarding a map collection of Korea:
"After one looked at the world, one could turn the page and peruse more detailed maps of the countries that were important because of their proximity [Japan, Korea, etc.]... These were followed by a general map of Korea and individual maps of its eight provinces"
So as an explanation of the errors in latitude and longitude, I propose that the Vingboons map represents a reconstruction of a lost cover map of a map book section covering North America. Just as Harris found a cover page map with the rest of the book missing, so someone found the detail pages of western North America without the cover map. They were forced to put together a cover map from the succeeding detail pages. Certainly they didn't get the big picture correct from the pieces, but who could? No western explorers had been there yet, and most of the Chinese knowledge of this part of the world had been lost, as Rees describes in her book.

I removed all the names, and water color and changed all to red for visibility. I tried to layer this on to Google Earth but it was a dismal failure to try to fit all the map at once. Vingboons was faced with putting together probably nine pages into one map and used orientations and some size changes that were slightly different on each. I had to cut the map into small pieces and paste each piece to a satellite background. This is what I have done in the following pages.

Finally, having determined where the River, the Lake, and the Rockies were supposed to be, I adjusted their positions. These are approximate, but close. This is pretty much how the map should have looked. The Lake drains out the river shown in the lower left corner of the lake, but I have no idea where it goes, just that it doesn't connect to the Rio Del Norte.
Using Jupiter's Moons As A Clock

I had puzzled for several years over how the ancient mapmakers had managed to achieve what modern mapmakers had not been able to do until the 1800s: to determine their longitude with such high accuracy. Finally, through my lifelong interest in astronomy, I realized that the moons of Jupiter provided a better clock than any mechanical device available to mapmakers until the advent in the 1800s of high quality mechanical clocks. All one needed was a small telescope. But the ancients didn't have telescope lenses, did they? I set out to find out and soon came across Robert Temple's book "The Crystal Sun". Temple documents his treks through hundreds of museums on a quest to find evidence that the ancients had lenses. And he found them: over 500 lenses are in museums across the Northern Hemisphere, usually mislabelled or not identified as lenses. He recounts stories of the Carthagians receiving messages island to island, in sixty mile hops across the Mediterranean, which could not be done without a telescope. He found a picture of a vase with a Greek person actually looking through a telescope. (Image to left. Click to enlarge.)
Ancient lenses were ground from large quartz crystals so most were no larger than a few inches. Was this enough to track the moons of Jupiter? I tried it myself. With a 70mm (2 3/4 inch) telescope and a table of events for Jupiter's moons, I was able to time the reappearance of a moon from behind the planet to within about two minutes. This converts to a position on the globe of within a few miles. It's like having a clock in the sky. Did the ancients have a table like this? I have no doubt that they did. The orbits of the Jupiter's moons are extremely regular and over time can be measured with great precision. Their future positions can then be calculated. Sample calculation: "Moon Position Calculator"
The Lake and the Rio Del Norte

Prominent on the Vingboons map is the large lake in the upper left corner and the Rio Del Norte river that winds its way to Hermosillo on the Gulf of Mexico. That no large river entered the gulf at Hermosillo in the days of the explorers is pretty certain, as a river this size would be noted as a prominent feature. The Colorado river was a prominent feature at the north end of the gulf and was certainly recorded as a river eventually, when it was politically acceptable to admit it was just a river and not a path to the inland sea that would make California an island. ( for a description of the politics, see "The Island Of California, A History of the Myth", Dora Beale Polk, page 134.
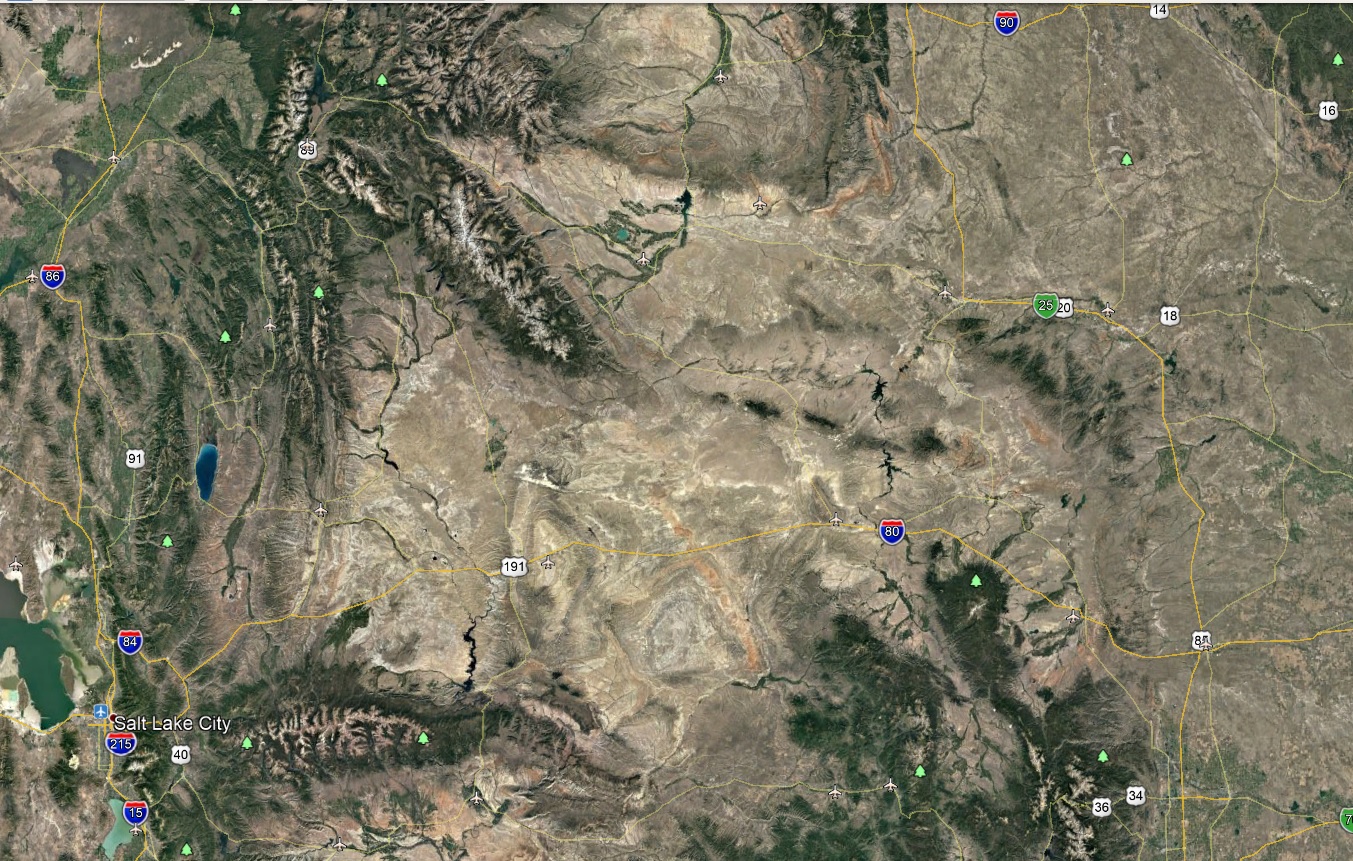
In the map views in these papers, I have reduced sections of the Vingboons map to a red outline and overlaid them on a terrain view from Google Earth or Marble. In the first view the Rio Del Norte, from the Gulf of California up to the Rockies, has been overlaid on a terrain view of southwest U.S. and and the northwest corner of Mexico. Following the river valley up from Hermosillo we find ourselves following a transverse river valley, cutting through the mountain ranges at right angles. This river valley is now home to the Rio Sonora. This is the path Coronado took on his campaign of conquest in 1540, (The Coronado Expedition to Tierra Nueva, Richard Flint, page 77) Why didn't Coronado mention a river flowing all the way from Hermosillo to the Rockies? And if this river is just a creation of Vingboons or someone else of that time period, how is it that it lines up so well with the delta at Hermosillo and traces the path of the Rio Grande through the Rockies? (more on that below)
Notice where the river intersects the present day Rio Grande just south of "Truth or Consequences" at a point about 55 miles due west of White Sands, New Mexico. From this point north, the alignment between the Rio del Norte and the Rio Grande is undeniable. We can follow the river up into the large ellipse of the San Luis Valley in southern Colorado, where the Rio Grande turns west. Thanks to the ancient map makers, we have a map of the northern part of the Rio Grande long before this area was explored by cartographers equipped to make such a map.

Turn now to the second picture, the northern part of the river, which continues north in a path where there is no modern river. From the San Luis Valley northward I found it necessary to rotate the map of the Rockies six degrees counter clockwise to align the river with the valleys in the northern Rocky mountains. (Click on the map for a larger view.) Small alignment problems may be due to the map projections used for the backgrounds (I am not a cartographer). You can see that the river follows the valleys all the way through the Rockies. The river then connects to the lake, which ends up being at the north end of the Thunder Basin of Wyoming, right by Gillette. At least that is one interpretation of the correct location of the lake.
The other interpretation, shown to the left, is that the lake was the ancient Lake Gosiute. Compare the Gossuite view with the Vingboons Lake in the next image. The two indents in southeast side of the Vingboons lake match the two mountain peaks in the southeast side of Gosiute, the bay at the southeast side of the Wind River Mountain matches the bay in the upper left of the Vingboons map, and the river on the Vingboons map exiting at the lower left looks like it matches the direction of flow out of the lake in the southwest corner of Lake Gossuite.
Since the map was assembled from pieces, the pieces may not have been arranged correctly. The position of the lake is inferred from the Wasatch mountains to the west and the Rockies to the east. As we will see later, Vingboons' map put the Wasatch range three degrees too low, and we will find that Vingboons' Rockies have other problems. The section of the river in this view of the Rockies, on the other hand, is placed only one degree low by Vingboons. (I have removed Vingboons' mountains from this view of the river flowing through the Rockies). It appears the lake and the river are not connected to the Wasatch Range or the Rockies, but came from a map section of their own. More work is needed on the location of the lake.
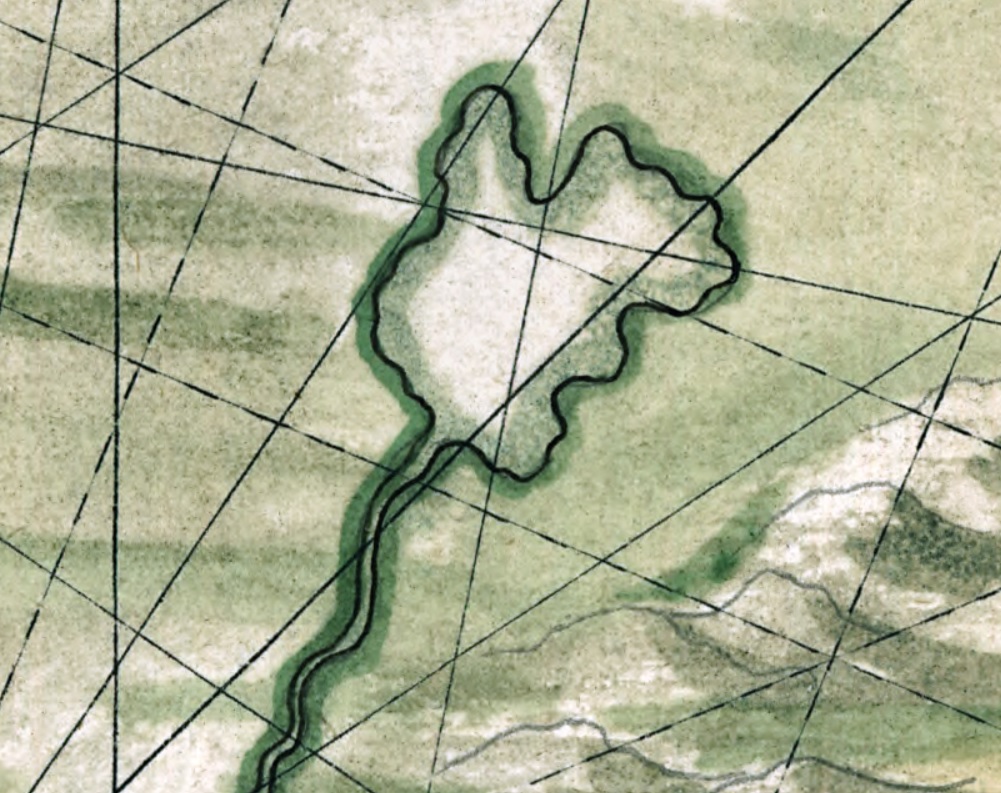
Attempts to overlay the Vingboons map directly on to the Google Earth view have been frustrating. Although you can see that the major features match up, you have to stretch different parts of the Vingboons map of the lake in different directions to get it to match Google Earth. I have not worked this out yet.
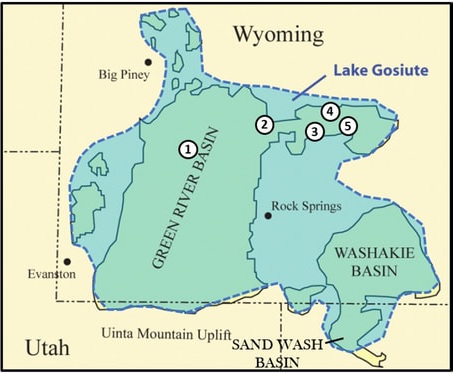
To the left is a map of Lake Gossuit geology. This map makes us realize the boundaries of the lake were not static but were changing with major events such as the progression of the ice age and the uplift of the western states. The Vingboons map is a snapshot in time, probably when the lake was very full. The drying out of the earth after the ice age would have greatly reduced the river water supply into the lake. The uplift may have changed the location of the river flowing out of the lake.
Looking at the entire path of the river, if the Spanish, or other post-Columbus explorers provided the information for Vingboons, why didn't they show the modern path of the Rio Grande, emptying into the Gulf of Mexico? And if they didn't provide the information, then who did? And when? How long ago did the Rockies empty into the Gulf of California? Not recently.
The Mouth of the Rio del Norte
The Rio del Norte originates from a large lake and drains a large part of the country into the Gulf of California, so we would assume it to be a major river. We would expect to find some evidence of a river delta if we went down the coast of the Gulf looking for it. And indeed, we find at Hermosillo more than we expected. (It was necessary to rotate this part of the Vingboons map by six degrees counterclockwise to align the Vingboons map with the terrain view from Google Earth.)
Hermosillo lies at the top of a delta that extends nearly fifty miles along the coast of the Gulf of Mexico. The delta is comparable in size to the delta of the Mississippi or the Colorado. There is not another delta like it on the Gulf of California coast. The entire delta is being farmed, due to its good quality alluvial soil.

This delta was not formed by the present day Sonora River, because I don't believe that the Sonora River drains nearly a large enough area to produce such a delta. The Mississippi river drains a huge area and has no larger of a delta.
Vingboons' coastline of the river at Hermosillo matches up well with the modern banks of the channel in which Hermosillo lies. The bends in the Sonora river match with Vingboons' river also. This information could have been obtained from the Spanish, although, as I have mentioned elsewhere, they would not have given it to him, and they probably didn't have it, as they no details of inland geography show up on any maps of this area that I have found.
Finally, it is obvious that the Vingboons coastline is quite a ways inland of today's coastline. The current elevation of the Vingboons coastline shows that the ocean would have had to have been about 300 feet higher along the delta. The removal of water from the ocean by the current polar ice caps might be have caused this, placing Vingboons's source map before the ice age. Or an upward movement of the tectonic plates could have lifted this entire area as it did all of Nevada, Utah, and Colorado. The Great Basin area of Nevada-Utah-Colorado was uplifted by over 7000 feet, so 300 feet here would not be too hard. The "Gulf of California eastern shore" page looks at the Vingboons coastline south of Hermosillo. We find that it also can be aligned with a line well inland of the present coast corresponding an ocean level about 300 feet higher.
The Wasatch Mountains

Looking on the map to the west of the Rio del Norte, we find a mountain range that, when overlaid on the Wasatch mountains of Utah, fits beautifully. Note the alignment of both the Snake River Valley, and the Great Salt Lake. Note the ends of the range on the map line up exactly with the actual north and south extents of the range. The extension of the mountain range to the west lines up with Matterhorn Peak in the Humbolt National Forest, northwest of the Great Salt Lake.
To line up the map's mountain peaks with the actual latitudes of the Wasatch mountains, it was necessary to shift the map image about three degrees north from Vingboon's coordinates. This need for a shift occurs in other areas of the map and is evidence that Vingboon's source map was made from smaller maps pieced together. It is also evidence that Vingboons was not using maps or observations from contemporary sources, or they would have reported the correct latitude.
What then was the source of information when the first California as an Island map was published in the 1620s, or Vingboon's information in 1650? This area was not explored by western people until the following century, and even then the information was not made public until the 1800s:
"Several expeditions,including those of Father Eusebio Kino, José de Urrútia and Nicolás de Lafora, and Father Silvestre Vélez de Escalante, had explored large parts of the southwest. However, the geography of this region remained virtually unknown outside the Spanish empire, since the maps and accounts of Spanish exploration remained in manuscript and were not published. Not until the beginning of the nineteenth century, when the noted German geographer Alexander von Humboldt visited Mexico City and was given access to the Spanish archives, did this information become more widely available." Library of Congress Exhibit: "Rivers, Edens, and Empires: Lewis and Clark and the Revealing of America"
Obviously a very good map of the Wasatch range was made by someone well before 1620.
The Rocky Mountains

Try as one may, and I have, one cannot align the Rocky Mountain range on Vingboons map with our Rocky mountains. There is just no mountain range to the southeast of the Rockies that sticks out into northern Texas and Oklahoma. Having worked the problem over for hours (and thinking of the fish) I finally sat back to try to look at the problem from a different direction. That's when pieces suddenly came together: There is a ridge at the southern end of the great plateau that runs across northern Arizona and New Mexico. I had not found a corresponding mountain range on Vingboons map, but had put the problem aside. Now I noticed that the west end of this ridge curves down and then runs east. Hmmm... the south end of Vingboon's Rockies curves down and then east. Could it be? Let's try taking the southern half of Vingboons' "Rockies" and shifting them west into Arizona.

One could not ask for a better fit. We have to raise the section about one degree north, but we have had to do that to other parts of the map already. The person who put together Vingboons' source map simply got a piece in the wrong place. How were they to know? They had never been there. The original mapmakers who had divided up their main map into smaller detailed sections had chosen to split it at a logical break in the mountains at Arizona's northern border.

Now we are left with what to do with the north half of Vingboons' Rockies. One possibility is that the Rockies section was rotated 45 degrees clockwise. We can try it: this is fairly successful. It does look like the general shape of the Rockies. Most of the mountain peaks line up with peaks in the Rockies. We have no firm markers to verify that it is correct, other than it fits quite well, so for now let's go on.
The Gulf of California Eastern Shore
The eastern shore of the Gulf of California is detailed, on Vingboon's map, with rivers that start in the mountains and run straight southwest to the ocean. Apparently the Spanish names of the rivers were available to Vingboons, because he includes them on his map. As usual, Vingboons seems to be using the Spanish explorer's latitudes of the rivers and towns to place labels on the map. We won't at this time inventory the entire coast, but we will look at the section just south of Hermosillo as an example of the rest.
We can use the rivers as landmarks to make sure we are in the right place. However, the ocean level has lowered or the land has risen several hundred feet since Vingboons' source maps were made, with the result that Vingboons' shoreline is shown well inland of where it is today. It was frustrating trying to match the old map to the new until I understood this.
As reference points, Rio del Norte is lined up with Hermosillo, and the fork in the forked river in the lower left is lined up with the fork in Vingboon's forked river. Shifting the Vingboons map the usual one degree south for this area, we arrive at this view.

The coastline between Hermosillo and Guaymas runs along a north to south ridgeline. (click on map for larger view) The coastline turns in to run up into the valley just east of Guaymas, then back south to go around a small hill, then back up the next valley and so on. The match is excellent, it's just that Vingboons' coast matches where the coastline would be if the ocean level were about 300 feet higher. How did he do this from Spanish exploration records? Why would he do this from Spanish exploration record? Obviously he would have no reason to. When was the ocean 300 feet higher? Before the polar caps formed, in the days that Hapgood shows us the mountains under the Antarctica ice cap were mapped, before the ice age, and before the Atlantic Ocean floor cooled and sank.
This exercise can be continued south down the coast but from here we will proceed north toward the most interesting part of the map, the four islands.
Into the Channel: Connecting The Channel To The Gulf

When we try to follow the coastline south from the Phoenix area, we suddenly discover a big problem: the mouth of the Rio del Norte at Hermosillo is in the wrong place. I eventually discovered that there are three degrees of latitude missing somewhere between these two points. I believe the gap should be placed just south of Phoenix as I have shown on the map here. The coastline I have marked in green is the section that needs to be lowered. I have shown it in red at the bottom of the map where it should be.
But what do we do about the missing three degrees? I don't think it is a coincidence that the amount of shift, three degrees, is the difference between the existing north end of the Gulf of California, and the location of the north end of the Gulf found on some maps from the 1500s. I also don't think it is a coincidence that the location of the top of the gap at the latitude of Phoenix corresponds to the latitude of the north end of the Salton Sea. Polk has a map (page 150) by Domingo del Castillo made in 1541 that shows the top of the Gulf of California at 33.5 degrees latitude. That is the latitude of the north end of the present day Salton Sea. Looking at elevations of this area on Google Earth, it looks like the land needs to be only about 40 feet lower for the Gulf to encroach all the way to the Salton Sea. Check into the USGS map of earthquakes in California and you will find that the fault zone on the west side of the Imperial Valley is one of the most active in the country. A forty foot change in elevation over time is not out of the question. If Vingboons, or whoever put the maps together, had conflicting maps of this area showing a three degree difference in the location of the north end of the gulf, it could have been the cause of his arranging the maps with the Wasatch mountains three degrees too far south, and the other related errors. Certainly more work needs to be done here.
There are legends ( for example click here) of a lost pearl ship on the west shore of the Salton Sea in the Imperial Valley. According to legend a Spanish pearl fishing vessel ran aground here and was abandoned. If the Gulf extended to the Salton sea in recent times, perhaps there is truth to the story of pearls in the desert. Thanks to Cliff Paiva for sharing his research on the lost pearls.
Another legend, highlighted on the map with circles around the Panamint range in white and the Amargosa range in black, is the Paiute legend of Shin-Au-Av, which means "God's Land". The legend tells how the Shin-Au-Av, a race of giants, sailed their boats up the inland passage to their underground city, also called Shin-Au-Av, in the Panamint Range. The shoreline indeed touches the eastern edge of the Panamint range near Furnace Creek. Two sets of prospectors tell of falling through the floor of mine tunnels in this area into ancient tunnels in the Panamints that went on for miles and contained idols, mummified giants, and gold bars. The importance of this account to us is that, assuming it is true, it gives us a sequence of events that we cannot glean from the map itself. Since the Shin-Au-Av were sailing to the Panamints, the Panamints must have already been pushed up and stable so that the Shin-Au-Av could build caves in the mountain. The Sierra Nevadas had not been pushed up, since the west coast of the island still extended well into the Pacific. The uplift of the western states had not begun, or at least had not progressed to the inland passage, so the inland passage had not drained. The Paiutes tell of the gradual receding of the waters of the passage until they reached the modern boundaries of the Gulf of California.( Legend of Shin-Au-Av) Thanks to Randy Gordon for alerting me to this Indian legend.
Into the Channel: The Four Islands


Now we will venture north from the Gulf of California into what will be the most fascinating areas of the map: the channel separating the island of California from the continent. The locations of the four islands in Vingboons' passage prompted this entire study. My stumbling on their locations was as much divine guidance as perseverance. Once one figures out some reference points, the process of identifying ancient map features within the modern mountain terrain is much easier.
This is a very busy section of Vingboons' map. Let's start with an easy to see reference point, and one of the jewels of the map, the northern island, which I have dubbed Island A. I was happy to find exactly what I was looking for, but I didn't expect such a good fit. For reference, at the southern end of the island is George BM peak. The mountain range extending north from George BM forms the east side of the island. A prominent peak whose name I have yet to find marks the northern tip. The west side of the island is formed by the next range to the west. The valley between the two ranges causes the characteristic dent in the north end of the island.
Other features line up well with the modern landscape. The lake, Lago de Ora, lines up with with the valley containing Lund, Nevada, just southwest of Ely. The second from north island, which I have dubbed island B, lines up with with Burnt Mountain, near the "Area 51" nuclear testing facility. In general identifying exact features on the western shore of the passage is difficult, but here at least, the Weepah Hills, west of Tonapah look like a good fit with the bulge in the coastline. The entire inland passage has suffered a huge upheaval of thousands of feet, so getting even a general fit is gratifying. As has been the case for most of the map, alignment for this section required shifting Vingboon's map about one degree north. The Vingboons map was also rotated two degrees clockwise.
On the coastline between Island B and Lago de Ora (the lake east of island A) is a point of land that matches well with Stairstep Mountain in Humboldt National Forest.
Island C, third from the north, matches very nicely with Mt. Charleston, just west of Las Vegas, NV. Just east of Las Vegas is a point of land that corresponds to Muddy Mountains on the west side of Lake Mead. The north branch of the lake follows what Vingboons labels Rio de Anguch, which drains what is now Nevada desert.
Island D lies at the southern tip of Nevada, and has no distinguishing mountain, so I suppose it was just a flat sort of island that blends in with the terrain now.
Just east of island D is a point of land that matches up with Hualapai Mountain, just southeast of Kingman, AZ. And just off the tip is an island that matches up with a little bump of land that has no name on Google Earth or Google maps, but it is a good match all the same. This point of land is the west side of an inlet that Vingboons names R. del Thicon or Thiron (I have trouble with some of Vingboons letters). This river may have gotten its name from the Rio del Tizon that Hernando de Alarcon sailed up to sometime shortly after 1538 (Polk, page 146) which was probably the Colorado before it enters the Grand Canyon. This river extends north through the pass at the Finger Canyons of Zion National park, just northeast of St. George, UT to the Salt Lake area where it drains an area that is now landlocked. There will be a better view of this in "The North End of the Passage" section. This river also passes right through the middle of the Grand Canyon. This presents a problem, for either the mapmakers missed the Grand Canyon, which is hard to believe, or it wasn't there yet. And if it wasn't there yet, then, as I mentioned earlier, this map predates the end of the ice age, for it was the breaking of the ice dam at the end of the ice age that drained the great lake to the north east and carved the Grand Canyon. To add to the mystery, the other river branching off the inlet, R. de Coral, also crosses the Grand Canyon, giving us a second instance of the same problem.
Into the Channel: East Coast at the North End

Now let's look at the eastern side of the north end of the inland passage. I have shown the entire east coast from Pheonix at the south end to Boise at the north in order to show that the map scale is consistent throughout the entire east coast of the passage. The islands line up correctly, as does Phoenix at the south end of this map. The background map is from Marble with Mercator projection, which gives very good alignment with Vingboons all the way up the east coast.
The north end of Vingboons' eastern coastline fits nicely into the valley that Boise, Idaho rests in. The little bit of coastline north of Boise follows the base of the mountains. The bump in the coastline just southwest of Boise wraps nicely around the Owyhee mountains in the southwest corner of Idaho. Vingboons' unnamed river northeast of the north most island runs northeast up the valley toward Elko, Nevada. Today a river runs down this valley through Elko. To the north of Boise the Vingboons map trails off into nothingness. However, some other maps of the time, such as the Sanson map of 1657, show a rectangular peninsula pointing west from the end of Vingboons' coastline. I have so far avoided branching off into other maps because this project was so large by itself, but here I will just point out this one feature. The name of the peninsula on the Sanson map is Agubela de Cato. It points generally northwest on Sanson's and most all other maps of the era, but it points more southwest in the Louis Hennepin map of 1697 (or 1698 depending on your source). I think that it matches up well enough with the rectangular plateau northwest of Boise to be more than a coincidence. You can see the plateau in the very upper left corner of the above image.
The Island Coastline - Northern Portion

(Updated 6/6/2022) Since the map was made, the Pacific coast has been pushed eastward about 200 miles. The area that was pushed eastward extends from the top of the island at the north, to Point Concepcion at the south. This section of the coastline bears no resemblance to today's coastline.
In the overlay map to the left the northeast corner of the island forms a point that is created by the mountain range ending at the Willamete National Forest east of Eugene. The flat top follows the visible break in the coastal range just south of Eugene. Many "California as an Island" maps from the 1600s and the 1700s show the north end of the island as a distinct "M". McLaughlin categorizes maps by whether they have a "flat" or "indented" top throughout his catalog of California as an island maps ("The Mapping of California as an Island, an Illustrated Checklist", Glen McLaughlin). The "M" was the result of later pushing up of the coastal and Cascade ranges around Portland.
The salt lakes east of the northeast corner are evidence that there was a lot of salt water left there after the ocean receeded.
South on the Pacific side from the flat island top, we find the coastline from the top of the island to Point Concepcion extends 200 miles farther out into the Pacific than it does today. Because the geography of the coastline is so different from the present day, the Vingboons map offers no points of alignment with modern landmarks. Vingboons adorned this section of the coast with many names of features that could not have had any resemblance to what the early explorers saw, but rather assigned them the names given by the Spanish to the modern features found by the Spanish at that latitude.
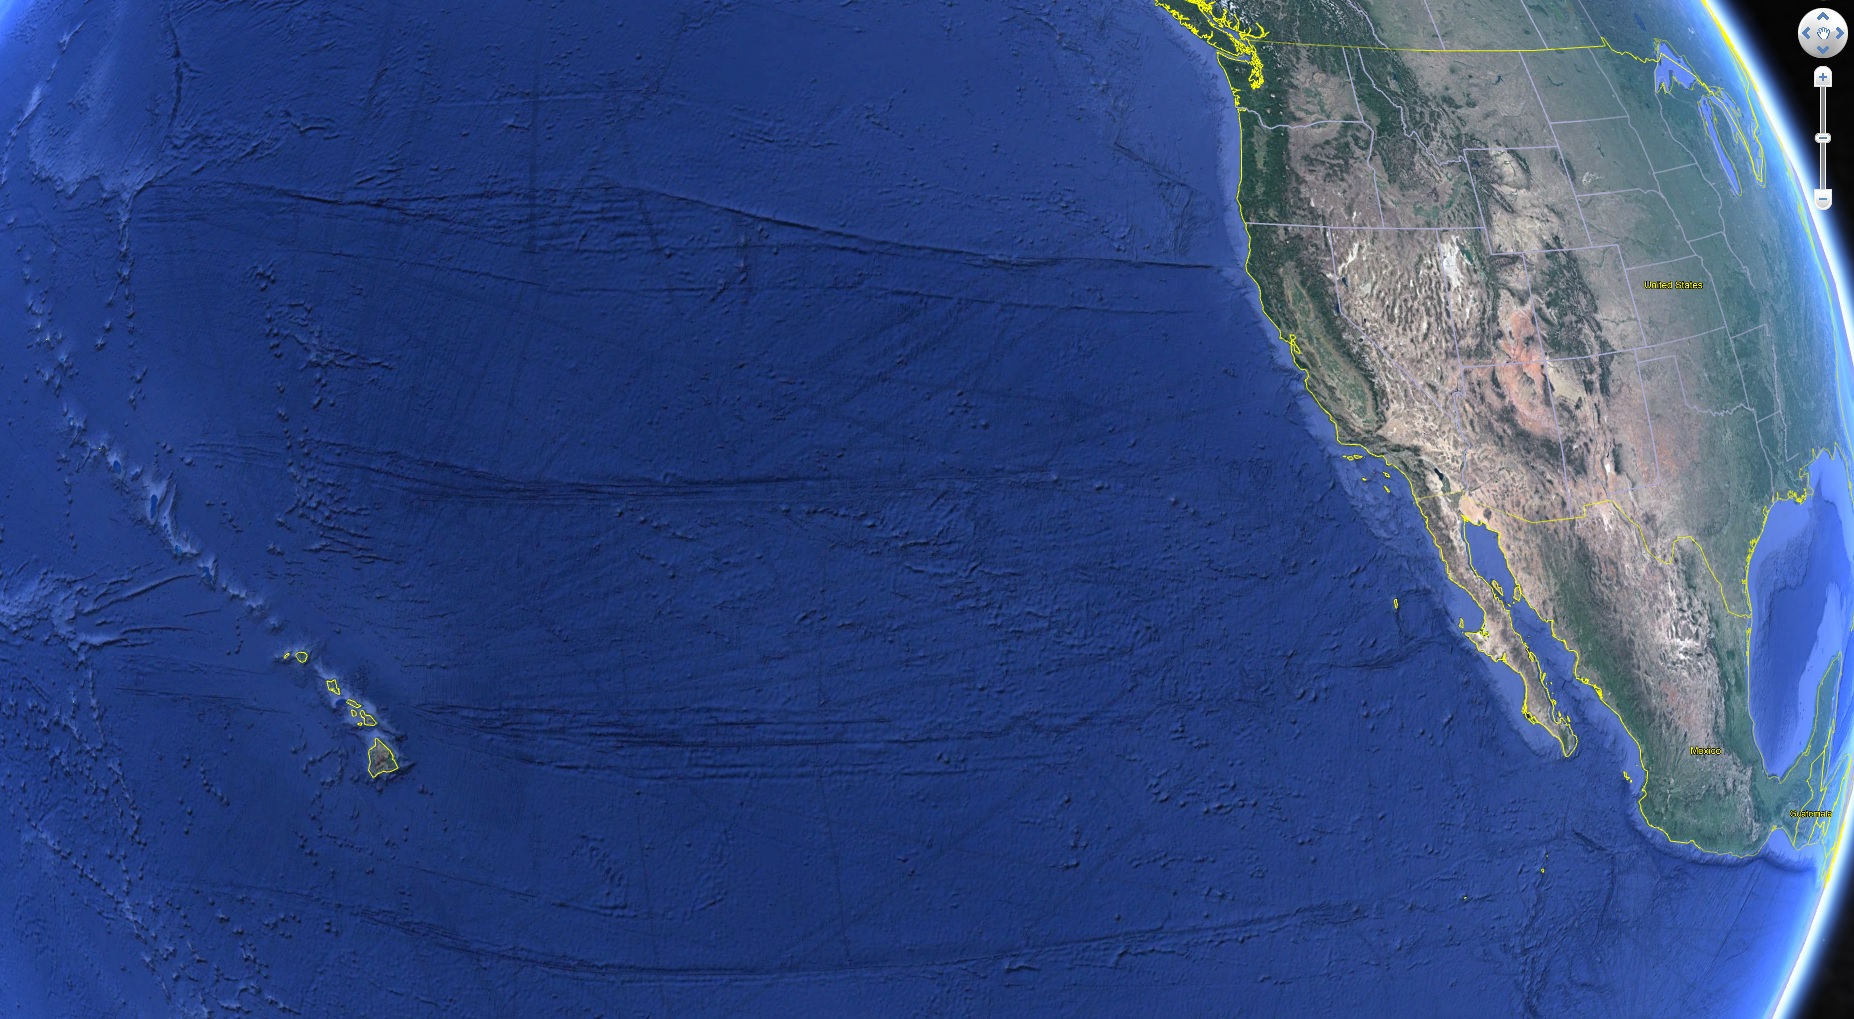
What caused this 200 mile eastward movement of the coastline? Plate movement of the Pacific seafloor. The Pacific plate is divided by many fracture zones running east-west, but two are significant to the map. The Murray Fracture Zone extends from the Hawaiian Islands chain and meets the continent at Eureka. The Mendicino Fracture Zone parallels the Murray Fracture and meets the continent at Point Conception. These rifts do not stop at the Pacific coastline but rather continue to the east coast, the northern rift to New York, and the southern rift to the active earthquake zone of North Carolina. These rifts gradually buckled the continent from east to west, starting during the Flood with the Appalachians. A midwest uplift buried under Mississippi river valley sediment was the location of the great earthquakes of 1811-1812. Before the map was made the Rockies were pushed up, then the Wasatch range in Utah, and lastly the folded ridges of Nevada. Finally, because the do not appear on the map, the Sierra Nevada and California Coastal ranges were pushed up after the map was made. These two ridges do not appear on an otherwise extremely accurate map. I must assume they were not on the source maps because they did not yet exist. The formation of these last two ranges pushed the island's coastline east by over 200 miles to where it is today.
Can we estimate when this pushing up of the mountains was complete? The easternmost range, the Appalachians, were pushed up during the flood. This marks the beginning of the process. The two California mountain ranges were pushed up last. The ice age began after the flood, and gradually covered mountains and large parts of the continents with great sheets of ice. The ice formed glacial valleys in the Sierra Nevadas so we can deduce that the Sierra Nevadas were pushed up early in the glacier period. The ice age lasted from about 200 to 700 years after the flood, so the Sierra Nevadas must have been formed in the first couple of hundred years. This means the map must have been made very early after the flood, perhaps in the first hundred years.
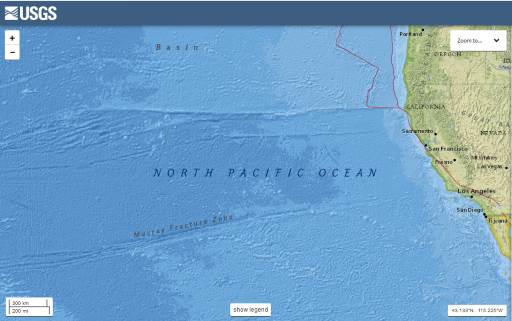
As the Atlantic rift opened, pushing North and South America west, the Pacific Plate was partly being pushed west and partly being subducted under North and South America. However, westward motion of the Murray-Mendicino block was being held back by some force, probably somehow connected to whatever created the Hawaiin Islands, causing more of the block to be subducted under the continent. The lack of give of this block caused the buckling of the block creating the mountain ranges across the United States. From the elevation color code of this USGS map of the Pacific ocean floor we see that there is a difference of about 800 miles in the displacement of the Murray-Mendicino block as compared to the blocks around it. The blocks above and below it were pushed 800 miles farther to the east. 800 miles of the Murray-Mendicino block were subducted under the western states, causing the great uplift of the western states that eventually caused the ocean to recede from between the island of California and the continent.
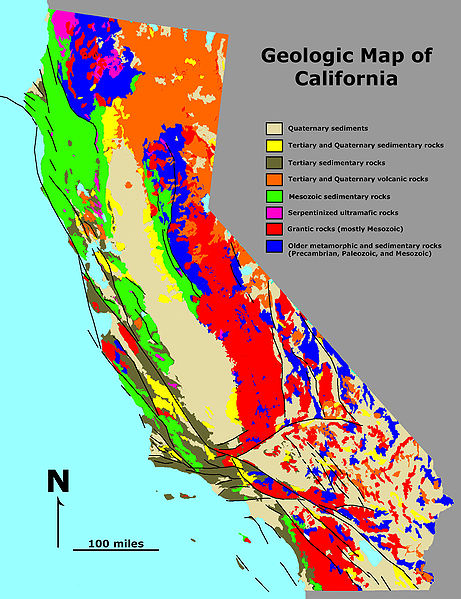
The difference in movement between blocks can be seen in this map of California geology. "Older Metamorphic and sedimentary rocks" are dark blue. There is a sharp break in the north-south run of this older rock between the Murray and Mendicino rifts. The locking in place of the Murray-Mendicino block held the older rocks in place while the continent to the north and south moved 50 miles west, past it. Geology explains the formation of the Sierra Nevada mountains as blobs of molten granitic material formed from subducted ocean floor, then floating upward to create the mountain range. Two problems are evident. First, as the map of California geology shows, the older metamorphic and sedimentary rocks have actually been pushed fifty miles east. Plutons rising to the surface would not cause this. What did cause the movement? I am still looking for an explanation from standard geology. The second problem is that the San Andreas fault moves north-south at the rate of about an inch per year, give or take, depending on who is estimating it. Over the course of 40 million imaginary years since the Sierra Nevadas formed, the Pacific Ocean plate of the Murray-Mendicino block, which is what actually pushed the Sierra Nevadas east, would have been offset from the Sierra Nevadas by 600 miles. Since there is no offset, this never happened, and the 40 million years is in error.
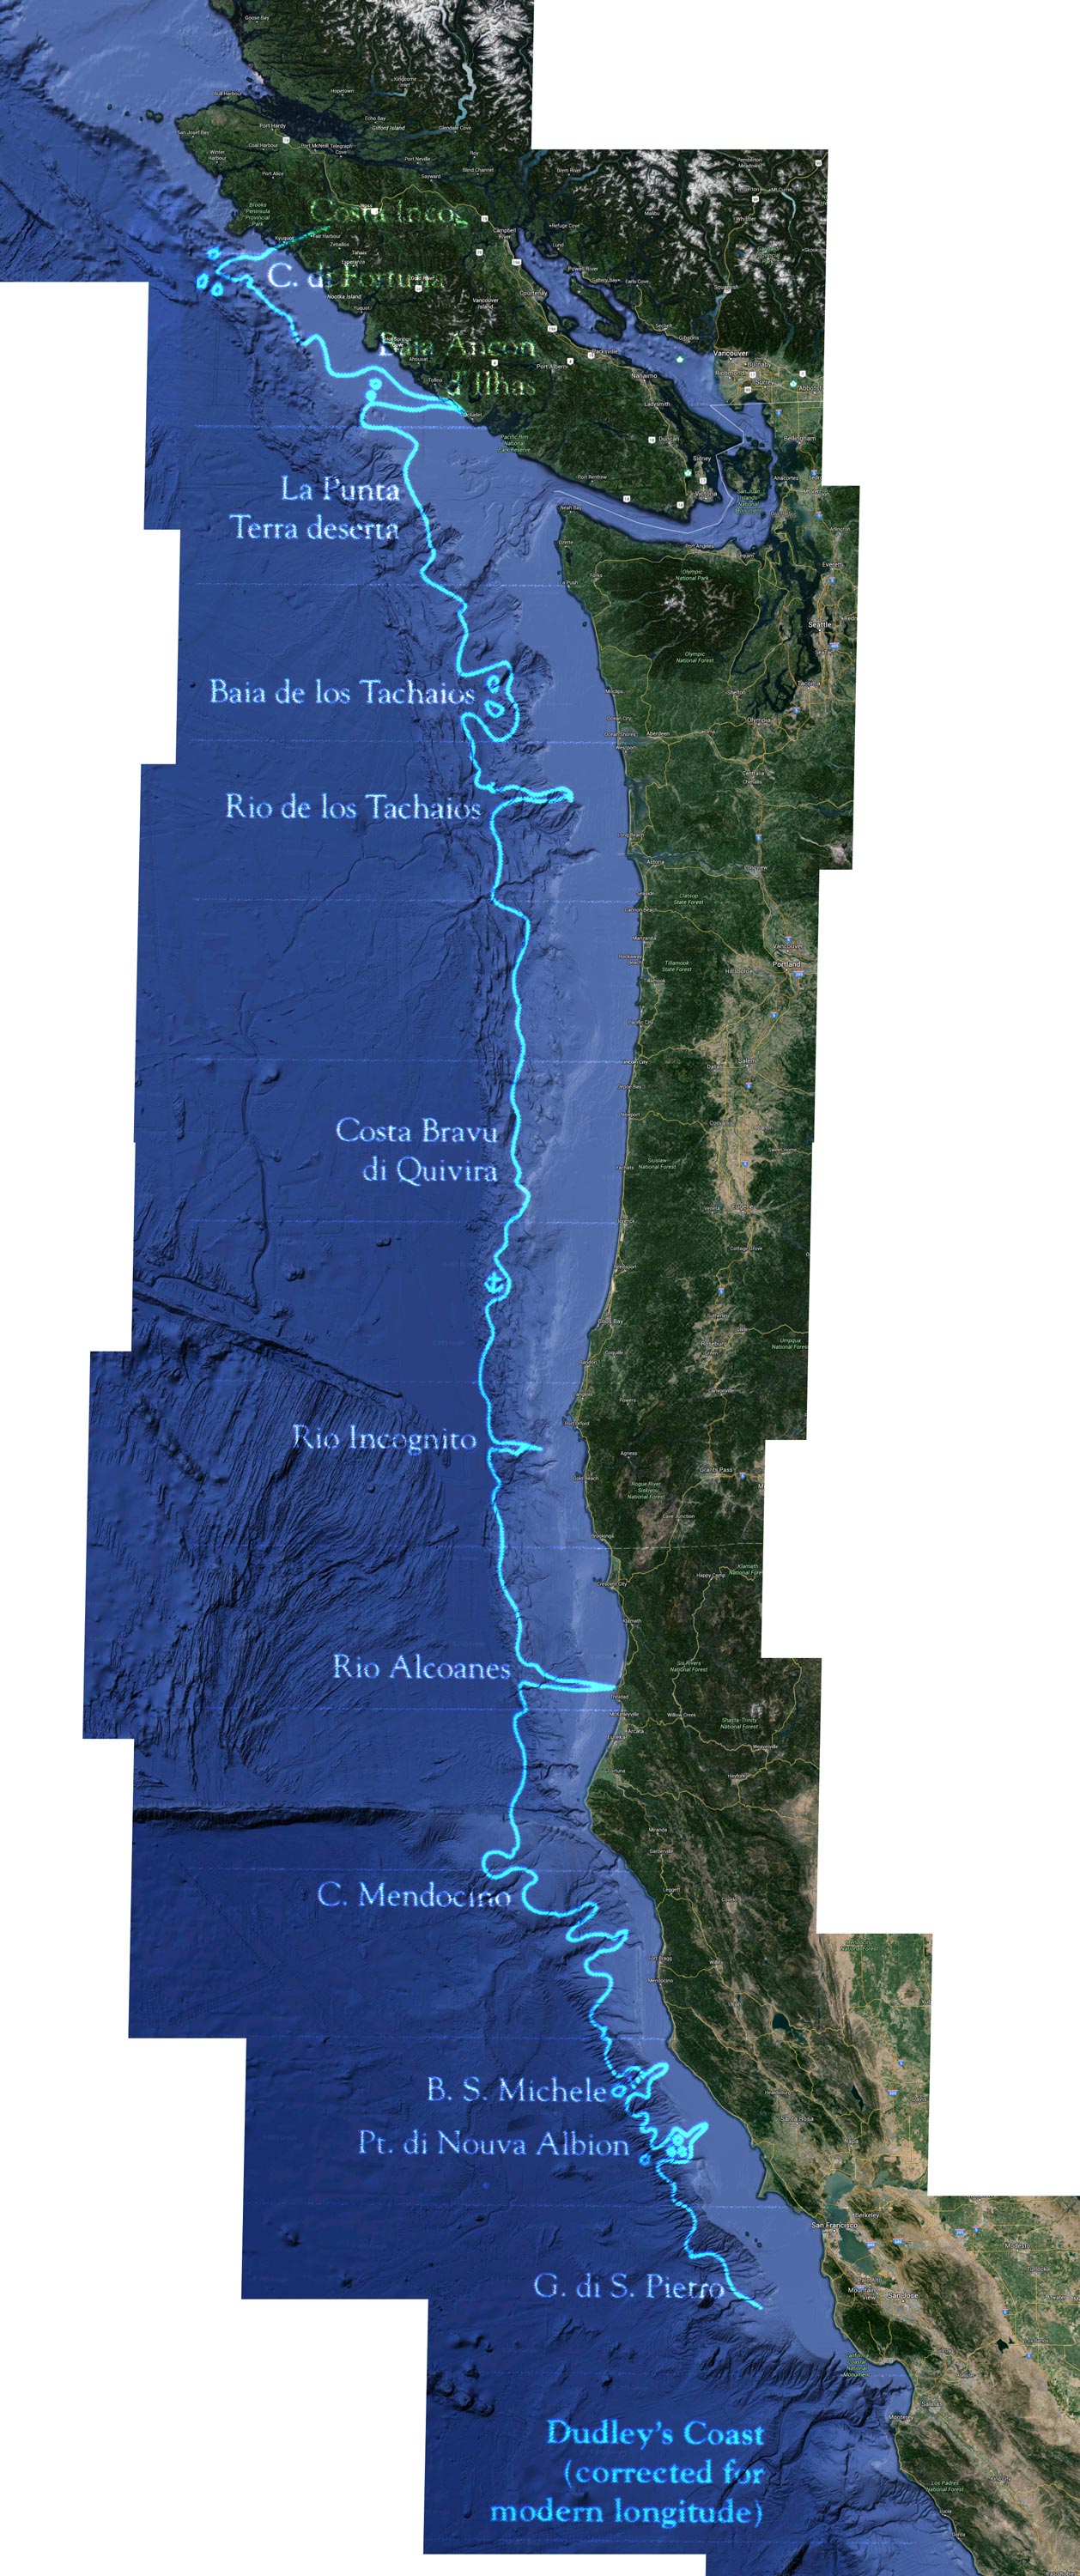
The map to the left is an overlay I created of Drake's California coastline onto the edge of the continental shelf of a modern map. Around 1579 Sir Francis Drake explored the coast of California and left maps from Pt. Conception to the north point of Vancouver Island. Drake's maps came into the possesion of Robert Dudley, who published them in 1647. Drake's map does not show the Strait of Juan de Fuca, and his coast line in many places follows more closely the continental shelf, than the present day coast (credit to my son Daniel for pointing this out). The mystery deepens on account of the description by Juan de Fuca himself of his voyage of 1592. Juan de Fuca describes sailing up the straight for 20 days, around the island and through a passage between many more islands. How did Drake miss the entrance, and also how did he miss San Francisco bay? Theories abound, such as foggy weather, or he was sailing to far from the coast until he had passed the straight. Or perhaps there was ongoing subduction as recently as the 1500s and the straight was not yet there. This account of the voyages comes from "The Land of Heart's Delight, Early Maps and Charts of Vancouver Island" by Michael Layland, available on Amazon.
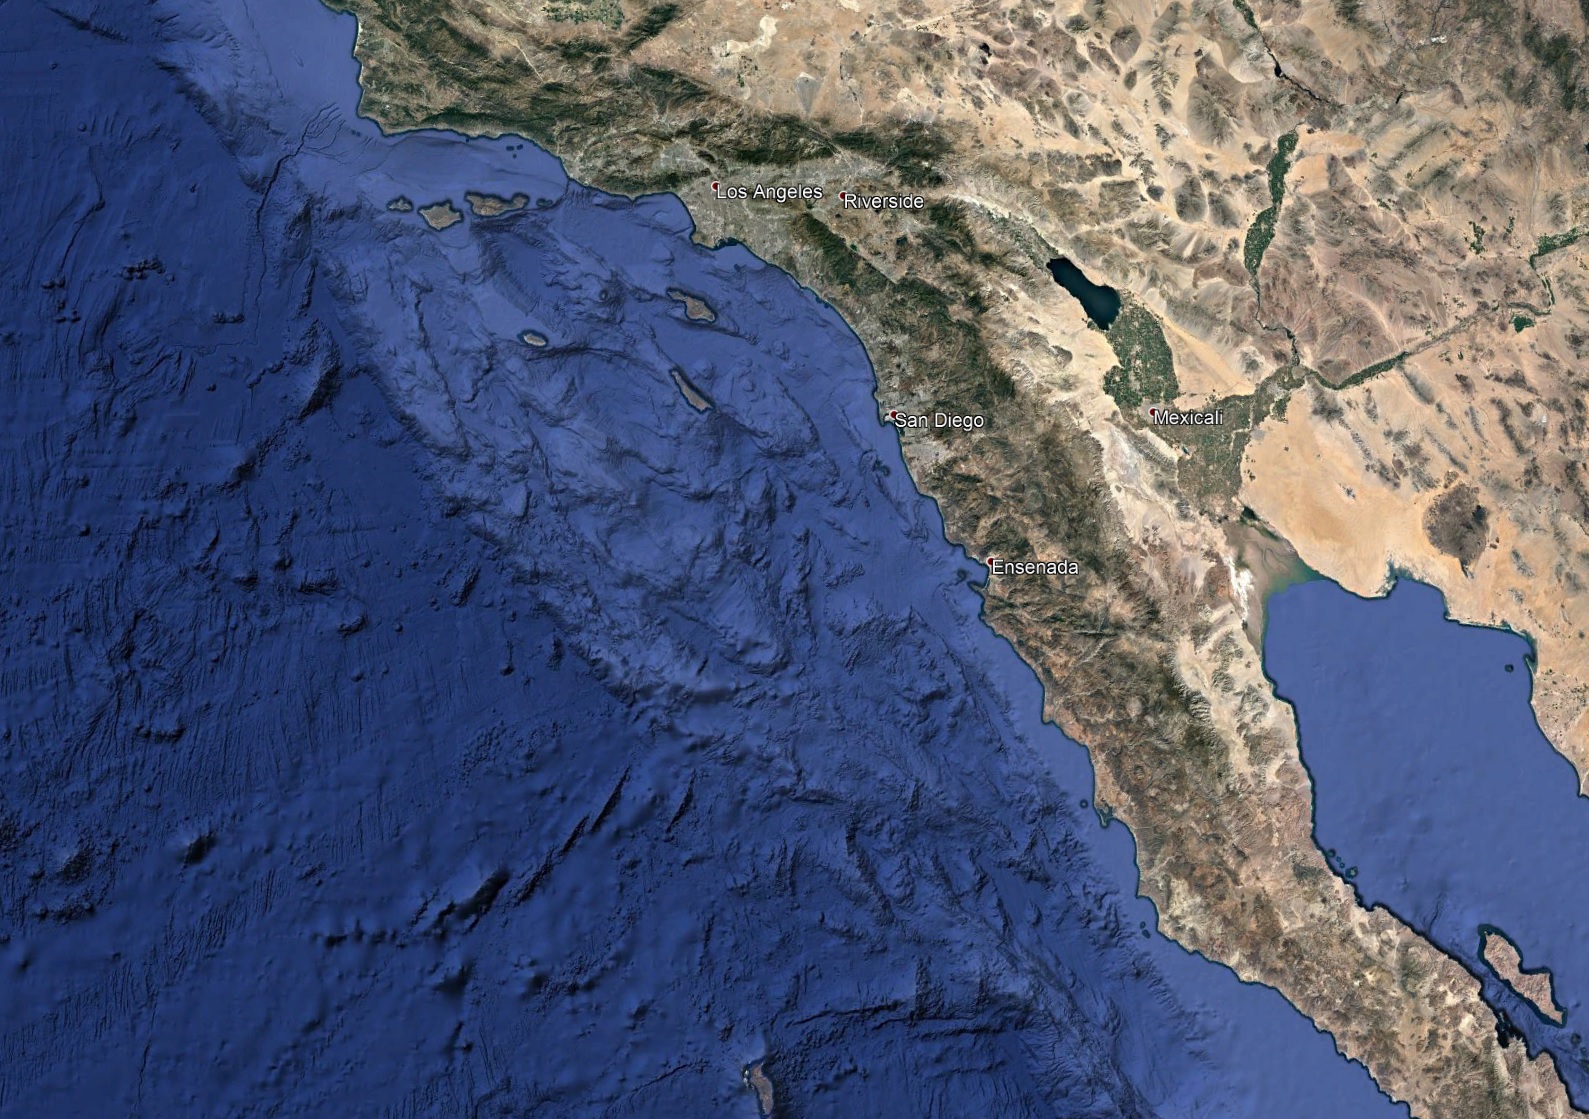
The continental shelf south of Point Conception down into Baja is noticably more rugged than for example, the shelf off the coast of the lower part of Baja. What the map shows as islands at the surface became underwater mountains as much as two thousand feet below sea level. This entire section of the continental shelf, in a scenario reminiscent of Atlantis, subsided a couple of thousand feet, submerging a block of continental shelf over a hundred miles wide and 450 miles long from Santa Barbara to Sebastian Vizcaino Bay in Baja. This should raise eyebrows of anyone living in Los Angeles, since most of the city south of a line from Santa Monica, to downtown, to Whittier, to Anaheim is less that two hundred feet above sea level. Could a fracture of the Whittier fault allow that much subsidence?
The Island Coastline - Eastern side of Passage
The east coast of the island, starting at the north end of the Gulf of California, follows the base of the mountains on the east side of the Imperial Valley, skirts neatly around the east end of the Angeles Crest mountains at Big Bear, and treks across the desert on the east edge of the Antelope Valley. There is a clear change in the features of the valley floor on the east and west sides of the coastline. East of the coastline the desert is awash with great sand flows formed when it was under water.
The north end of the inland passage, according to Vingboons, opens into endless ocean. It's doubtful the ocean was endless but apparently Vingboons' sources included no information on what lay beyond. Other maps of California as an island provide various versions of what lay north, but Vingboons' map is silent. Notations on many maps were politically motivated by the desire to find the mysterious passage of Anion, the northwest passage linking the Pacific to the Atlantic. This would have been a valuable trade route if it had existed.
The Island Coastline - Lower Baja Coast
The latitude of the southern tip of Baja lines up exactly with the true latitude. This is reasonable given that most of the Spanish activity in the area was inside the Gulf of California, so it was a well known feature. The shape of Vingboons' map, however doesn't really look like Baja California as we know it. Interestingly, though, it does look quite a bit like the Baja continental shelf. For the Spanish to map the continental shelf and send that information back to Europe for Vingboons to put it on his map obviously would never have happened. But due to changing ocean levels and ocean floor elevations the ancient mapmakers saw a much different coastline than we see today. At some point the ocean level was higher by 300 feet, as we see on the western coast of the Gulf of California. Did this affect the western coast of Baja? Or did subduction cause this change? The west coast of the Baja peninsula could have been more than 300 feet higher and has since sunk considerably. I am guessing the subduction that lowered the ocean floor of the Los Angeles area could have lowered the ocean floor on the west coast of lower Baja.
As mentioned in an earlier section, the eastern coast of the gulf suffers from the problem of the missing three degrees, so I have not included the east coast of the gulf in this view. With further work I think the proper locations of the coastlines of the northern part of the gulf can be established.
Maps With California Attached
We have been focusing on maps that show California as an island, but a number of maps existed starting in the 1500s, made by the Spanish and kept secret. Five of these maps predate Father Kino's historic treck in 1705 across California to settle the question of whether is was an island. Here are links to several of these maps by year of issue: 1548 1553 1597 1599 1606 1752 1757 1720 1765
Maps of the Mississippi Before the Uplift
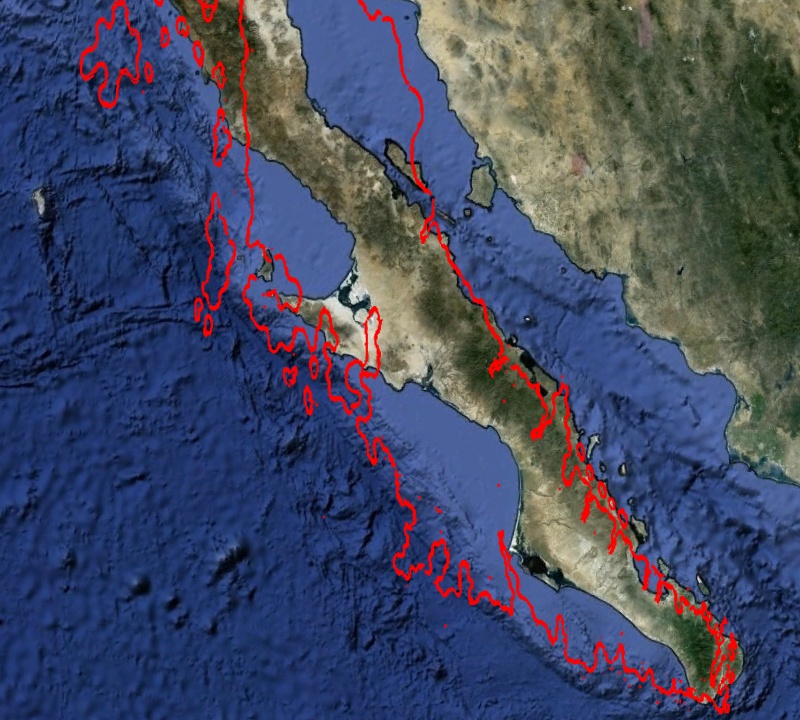
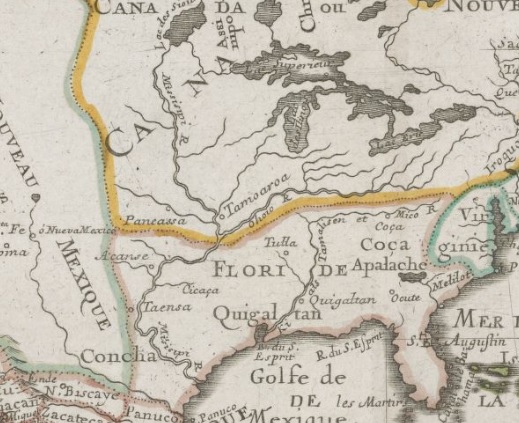
We have seen that the uplift changed the destination of the Rio Del Norte from the Gulf of California to the Gulf of Mexico. Could the uplift also have changed the route of the Mississippi? I found three maps in the Stanford collection that show more western routes for the Mississippi. The source maps for these three would have been later than the source for the Vingboons map, since all three show the Rio del Norte becoming the Rio Grande and flowing to the Gulf of Mexico. However each shows the Mississippi reaching the Gulf at different locations.
 Sanson 1705
The route of the Mississippi on this map must have come from an early source because the Mississippi flows to the ocean at Corpus Christi, its original entrance to the Gulf of Mexico before the uplift. The western part of the map came from a later map showing the Rio Del Norte flowing from Lake Gosuite to the Rio Grande. The eastern part of the map shows the Tamalisen (Mississippi) River flowing to the ocean at Houston, although the early explorer Henry de Soto placed it in New Orleans. Tamalisen was one of the many names for the Mississippi used by the early explorers, which means this map actually shows the Mississippi River twice, and it shows nothing at New Orleans where de Soto found it as it is today. The European mapmakers must have been very confused by the contradictions between their ancient source maps and the Spanish descriptions of the land. Here is an account of the exploration of the South by Henry de Soto in 1544: Henry de Soto
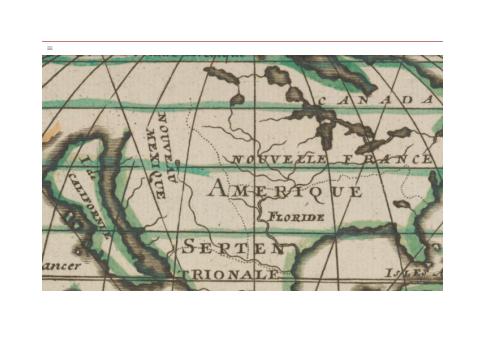 Moulart-Sanson 1705
This must be an early source map since the Mississippi flows to Corpus Christi, its original route, and it shows no river at New Orleans or Houston. It was not modified by any Spanish explorer data.
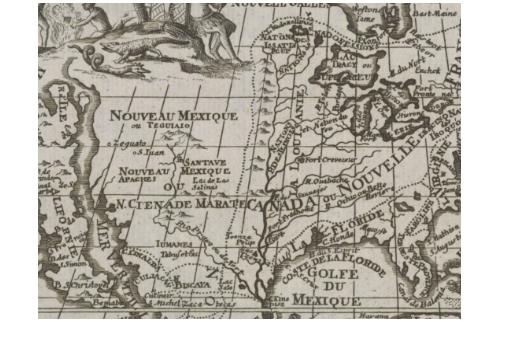
This map must have been made from the earliest source map, although not as early a source as the Vingboons source since this source shows the Rio del Norte flowing to the Gulf of Mexico. The Mississippi splits near the mouth of the Rio Grande to join the Rio Grande and also to proceed to the Gulf. This arrangement appears on one other map in the Stanford collection. The Ohio river appears to meet the Mississippi at San Antonio, well west of its modern route. The Wabash appears to meet the Mississippi in southern Oklahoma. For some reason there is no Lake Gosuite. The Rio Del Norte flows to the Rio Grande. No river is shown at New Orleans, which is surprising because the Spanish must have found it there. Again, the maps were being made in Europe by people who had never been there. A bay is shown at Houston but no river.
The maps contain many other features such as the Great Lakes, that all deserve attention, and would each fill a book.
Conclusion
And so we come to the end of our tour of the Vingboons map. I hope you have enjoyed this presentation. It is difficult for people to suddenly be presented with evidence that everything they have been taught about millions of years of continental drift, a hundred thousand year ice age, and gradual changes over long periods of time, has all been incorrect. But here is the evidence. I am grateful that the maps discussed here have been available for hundreds of years, because there can be no claim that these maps are recent forgeries. The maps were copied from much older maps by people that had no idea what this area really looked like. Their passing down copies of the very old maps has benefited us, for now we can see today just how recently the continental uplift and the ice age occurred.
As mentioned above regarding changing ocean levels due to changes in the Atlantic seafloor, I am including a bonus section for those that have made it this far:
Post Script - Another Island Deemed to be Mythological
The suggestion that Atlantis was an actual historical event will cause academia to smirk and roll their eyes. However, while studying the Pacific Ocean for California as an island, I began to wonder if we could determine the location of Atlantis in the Atlantic ocean. As it turns out, we can. Most of what we know about Atlantis comes from Plato, who describes it in much detail in two plays: "Timaeus" and "Critias". From the Wikipedia section on Critias we learn: "The Egyptians, Plato asserted, described Atlantis as an island comprising mostly mountains in the northern portions and along the shore, and encompassing a great plain of an oblong shape in the south "extending in one direction three thousand stadia [about 555 km; 345 mi], but across the center inland it was two thousand stadia [about 370 km; 230 mi]." Fifty stadia [9 km; 6 mi] from the coast was a mountain that was low on all sides ... broke it off all round about[21] ... the central island itself was five stades in diameter [about 0.92 km; 0.57 mi].[22]"
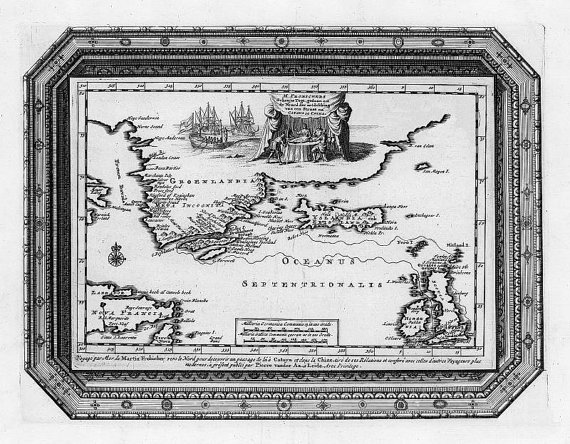
What ancient maps of Atlantis do we have? Athanasius Kircher's map of Atlantis, places Atlantis in the middle of the Atlantic Ocean. From Mundus Subterraneus 1669, published in Amsterdam. The map is oriented with south at the top. This map disagrees with Plato in several respects: the island is much larger than Plato describes it, both in length and width, and the single mountain is not where Plato puts it, six miles from the coast, but centered in the middle of the island.
However, as it turns out, there probably was an island at the center of the Atlantic. The intersection of the faults at Aruba form a triangle matching the size and location of Kirchner's island quite well. As Atlantis sank into the ocean, so would have Kirchner's island.
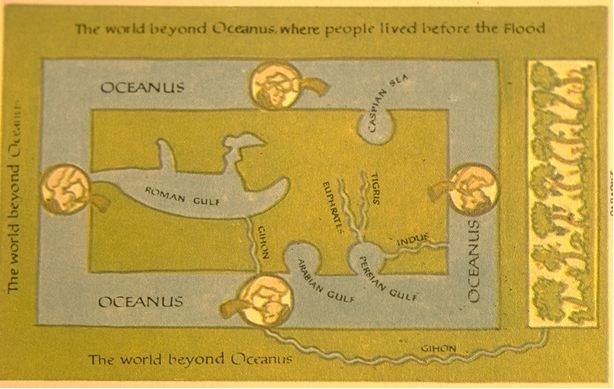
Apparently Atlantis was also called Oceanus, since these two maps of Oceanus shows the same layout as the Peri Reis map discussed below. The have the proper rectangular shape. They have inlet bays in the correct places. I am looking for information on their origin.
By far the most important map in the study of Atlantis is the Piri Reis map, which shows a large island off the east coast of the United States. We see it here as the rectangular island in the upper left of the map. The island is enlarged below. The coast of North and South America stretch along the left side of the map. Spain and Africa are on the right.
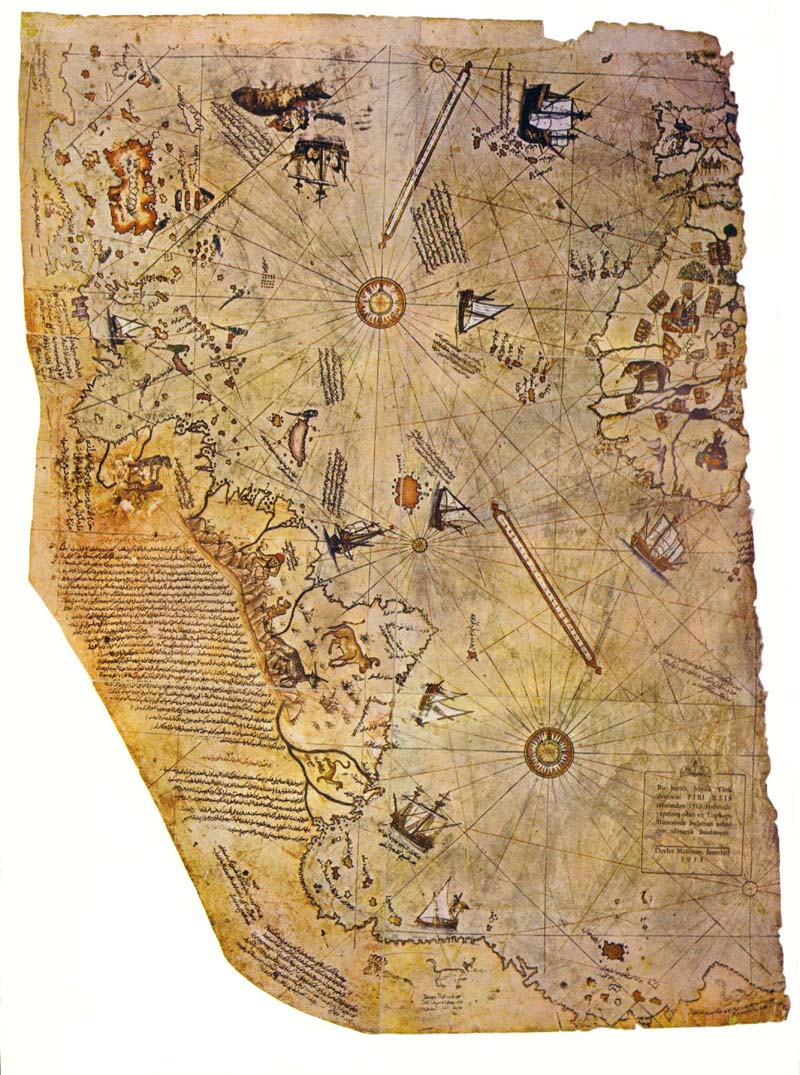 The width of the island, scaled from the size of Spain, is about 285 miles. Plato puts the width at 230 miles, which is pretty close, considering. The island's length from the map scales to 565 miles, considerably more than Plato's 345 miles, suggesting that Plato's 345 miles is the length of the plain at the south end of the island, which the text allows for, I believe.
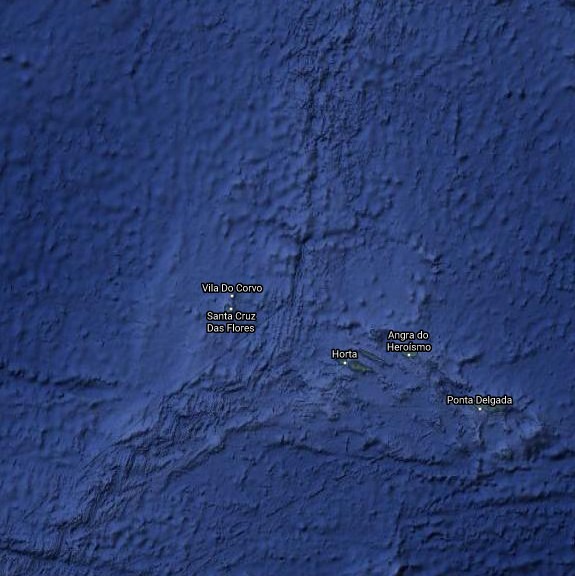
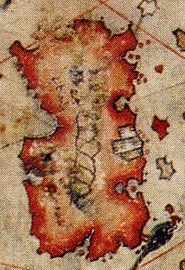 Here is an enlargement of the island, (complete with parrot, lower right). The large mountain on the island is the dark spot on the left (west) coast of the island. Now we have a map with which to explore on Google Earth the bottom of the Atlantic in search of a rectangular area with a mountain on the west side of it. We also know from Piri Reis that it is off the east coast of the United States and that the north end of the island is mountainous. And what do we find off our east coast?
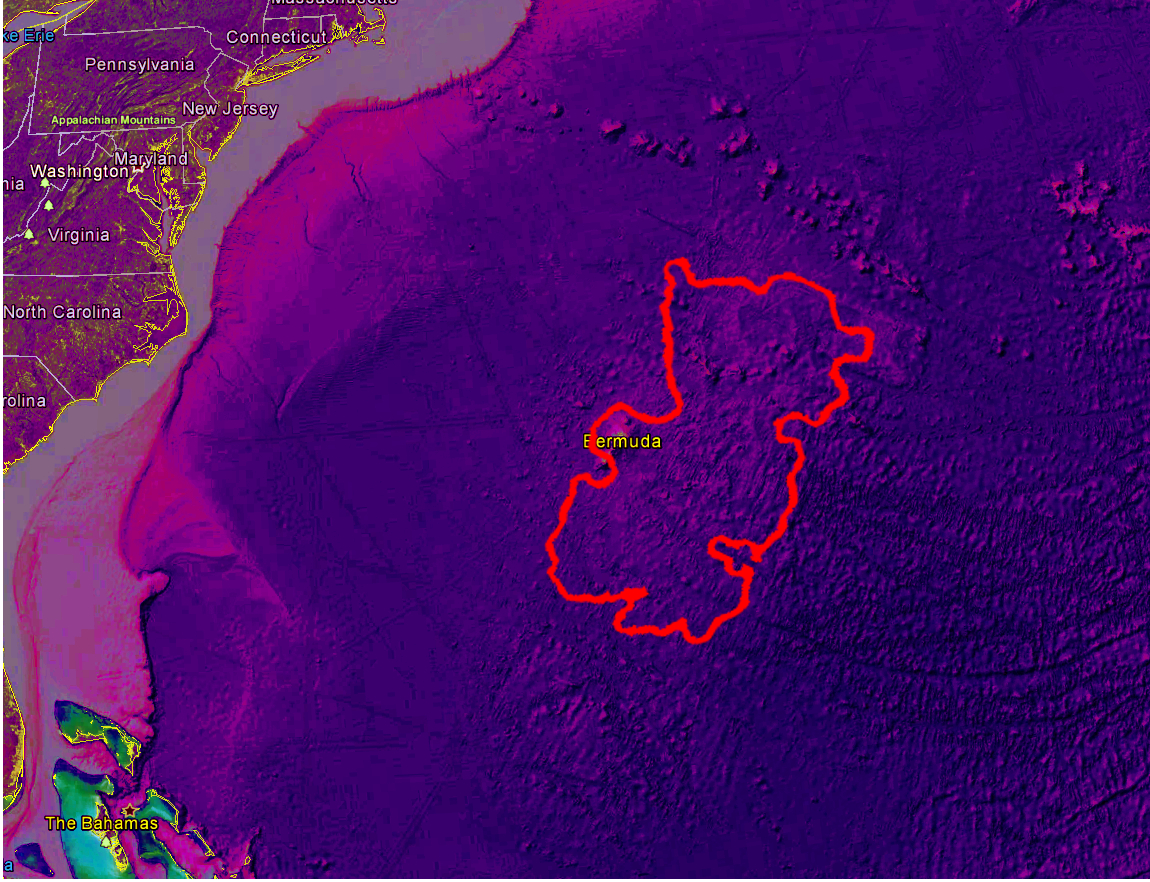 Starting with Bermuda as the main mountain, we find a large submerged rectangular area with about the same dimensions as given by Plato and confirmed by Piri Reis. We see mountains on the north end and Bermuda provides the large mountain on the west side of the island just where Piri Reis says it will be. The flat north and south ends of the rectangular shaped island are formed by the faults that spread west from the great fault in the center of the Atlantic seafloor. The north-south coasts of the island are in the same direction as the north-south fracture lines that cover most of the Atlantic and were formed by the new ocean floor formed by the flood compressing against the continents. (again, see Baumgardner for a description of this process). The contrast and color balance of this image has been increased to show the seafloor more clearly.
So the lost continent of Atlantis is found. And why did it subside? The forty days of rain that started Noah's flood were caused by the single continent Pangea breaking up along a fault line that we find at the center of the Atlantic Ocean, with a branch around Africa to India, pushing up the Himalayas. A complete new seafloor of hot lava raised the ocean temperature in that area and evaporated the sea water, which condensed and fell as torrential rain for forty days. The warm ocean floor continued to produce rain for several hundred years. Over the continents, the rain turned to snow, which powered the great ice age. Near the coasts, the warm oceans created temperate climates as far north as Siberia, where over six million Mammoths lived, then died when the oceans cooled and the lush vegetation died. The ice age lasted about 700 years after the flood. During this time the Atlantic ocean floor slowly cooled, became denser, and gradually sank, taking Atlantis and Kirchner's island down with it. As the ocean floor sank, it also drew in water from the earth's other oceans, lowering their water level by about 300 feet, and changing the world's coastlines.
About
These articles are my work and the result of my research. I have referenced all the sources I have used. None of these sources presents "California as an Island" as anything more than a myth. I graduated from UCLA in 1976 from the School of Engineering. I followed the course of study in chemical engineering. I was introduced to the whole topic of California as an island in about 2008 by Cliff Paiva, who was also researching the locations of features on the map. We have taken different paths in our efforts to decipher the map, but I much appreciate Cliff's getting me started.
If you have any questions regarding these articles, please email me at don@californiaasanisland.org
Copyright 2007-2023 by Donald Mark Kennedy